
How it works
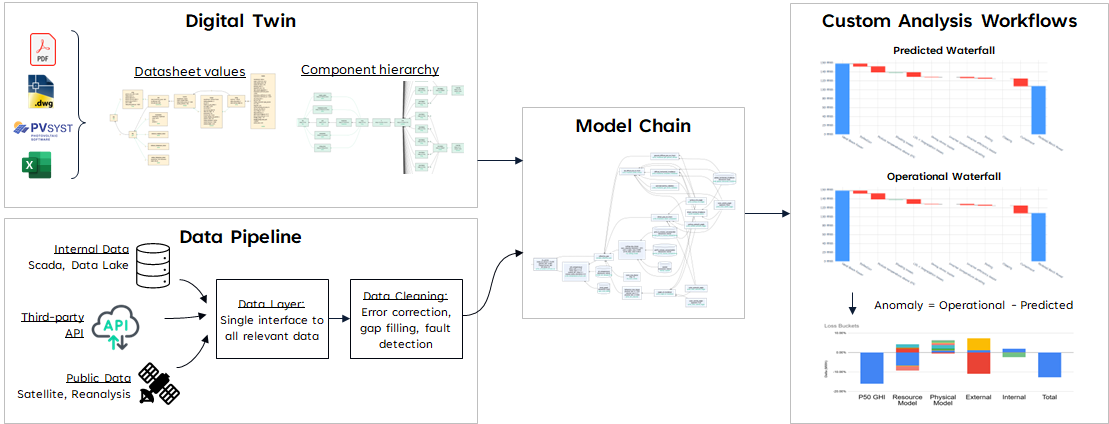
PVRADAR connects PV asset design, operational data, and physical models in one transparent modeling solution.
- Digital twins describe how each asset is built.
- The data pipeline turns raw measurements into analysis-ready inputs.
- The model chain defines how those inputs are transformed into requested results.
- You can host your custom solution on your infrastructure, in the cloud, or on-premise.
Digital Twin
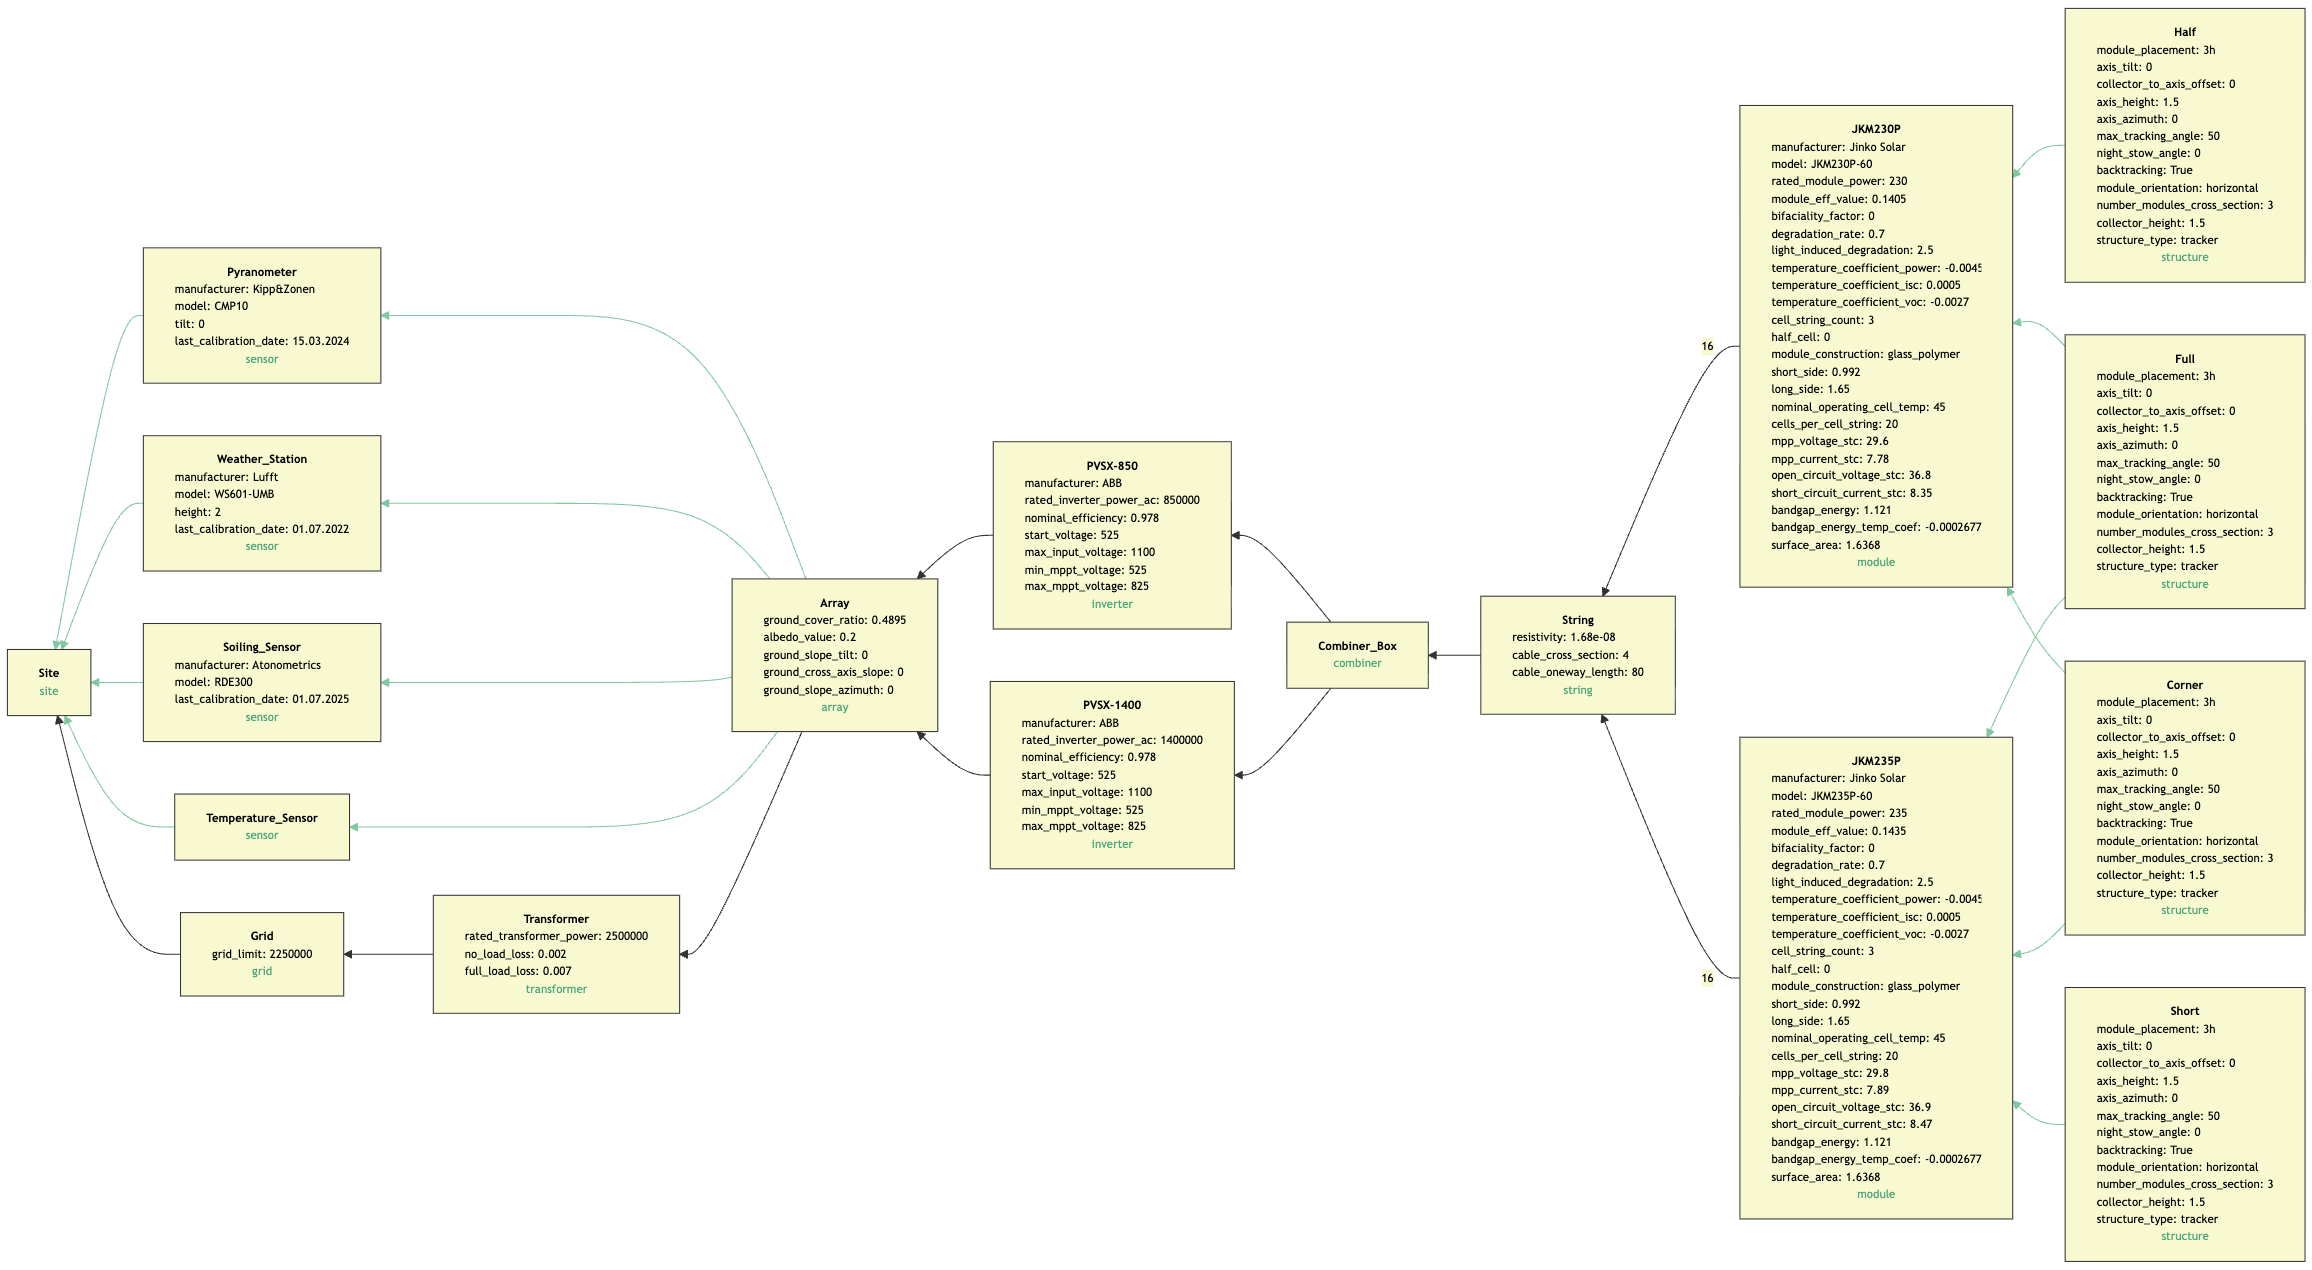
PVRADAR digital twins are structured, machine-readable representations of PV and BESS assets. They include a detailed description of an assets’ components, their technical parameters, and the topology or component hierarchy.
The digital twin model is flexible and can represent virtually any component or system configuration. For example you could easily represent an asset that combines trackers, fixed-tilt and east-west configurations.
At runtime, PVRADAR automatically builds and executes the appropriate calculation chain based on the asset configuration and the analysis being performed.
Digital twins can be created manually or generated automatically from PDFs, Excel files, DWGs, PVSyst projects, and other design documentation using AI-assisted extraction.
Data Pipeline
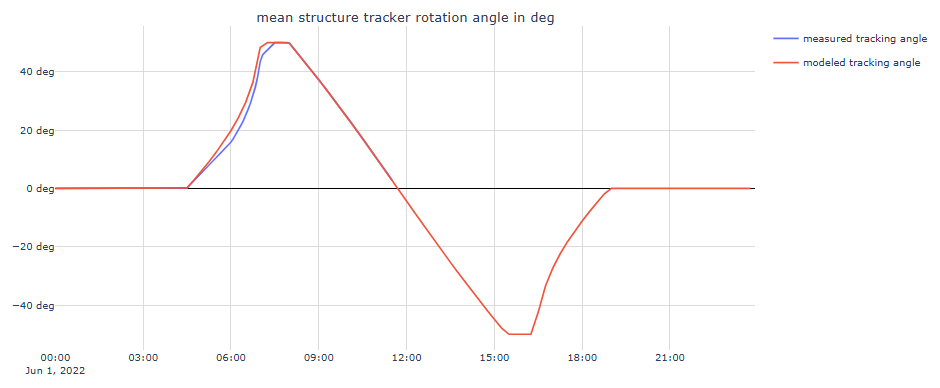
Operational data is rarely ready for analysis: Sensors can fail. Communication can be interrupted. Trackers can stop following their commanded position. Measurements can be shifted in time, duplicated, inconsistent, or missing entirely.
Our data pipeline flexibly combines data from your data lake with public station and satellite data, as well as third party irradiance forecasts and market prices, and fixes problems on the fly:
- detect and remove erroneous measurements;
- identify sensor, communication, and equipment faults;
- synchronize timestamps and measurement frequencies;
- fill data gaps;
- extrapolate missing measurements where appropriate;
- combine SCADA data with internal, third-party, and public datasets.
Model Chain
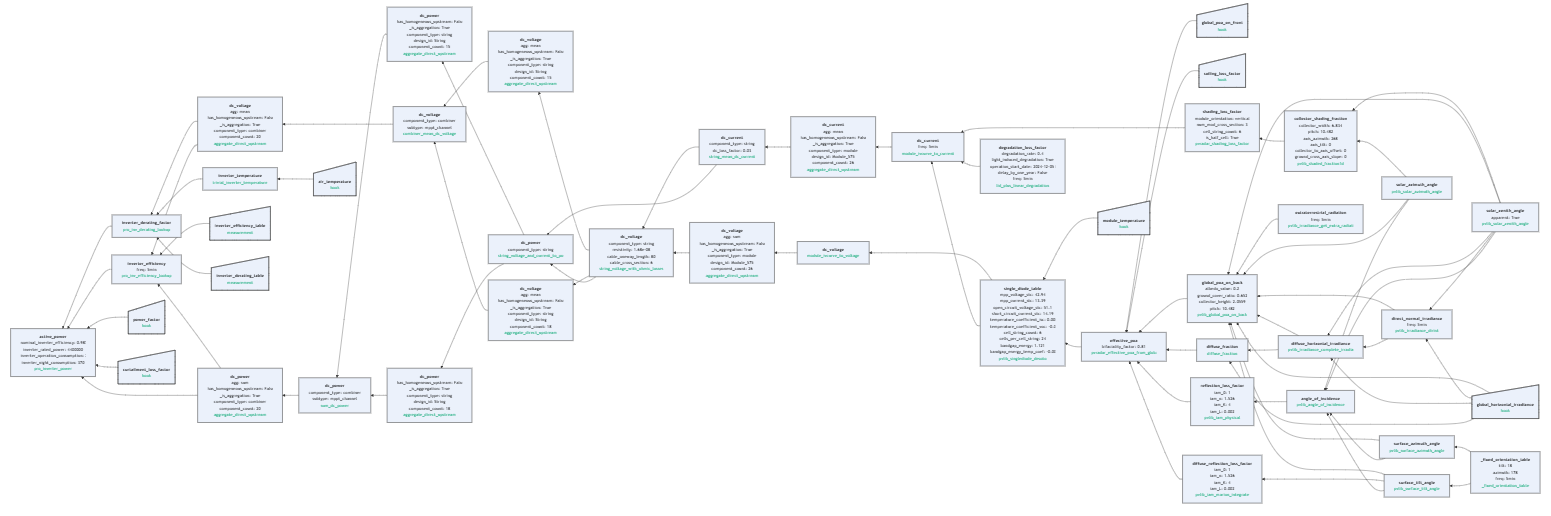
The model chain describes how raw inputs are transformed into the required results. For example, an analysis can start with meteorological conditions, calculate plane-of-array irradiance, module temperature, DC production, inverter conversion, electrical losses, and finally expected active power.
Each calculation is performed by an individual model with clearly defined inputs and outputs. PVRADAR includes a library of models for PV and BESS performance analysis (including all models available in pvlib), while also allowing you to use your own internal models or combine both.
Every model, assumption, and parameter remains accessible and can be inspected, replaced, or modified. If required the model chain of every result can be traced from the original input data to the final output.
Performance Analytics
Applications can range from individual engineering analyses to fully automated portfolio-wide workflows, including:
- automated underperformance analysis;
- loss breakdowns and root-cause analysis;
- production forecasting;
- PV and BESS optimization;
- automated engineering reports;
- portfolio-wide performance monitoring.

Hosting & Integration
The complete solution can run wherever you need it.
Deploy PVRADAR in your own cloud environment, on-premise, or integrate it into an existing analytics infrastructure.
Results can be written back to databases, consumed by dashboards such as Grafana or Power BI, exposed through REST APIs, or used directly in Python.
Because the modeling engine is not tied to a proprietary cloud platform, your data and calculations can remain entirely within your own infrastructure.
Python Framework
Everything is built on the PVRADAR Python framework.
The framework provides a common structure for assets, measurements, physical quantities, models, and calculations, from irradiance and temperature down to DC and active power.
This common foundation makes individual models interchangeable and allows custom analytics to be developed without rebuilding the surrounding infrastructure each time.
Your engineers can therefore work directly with the same models and data structures used by the automated applications.
This means you are not limited to the applications we build for you: you can inspect the calculations, modify models, create your own analyses, and extend the system as your requirements evolve.