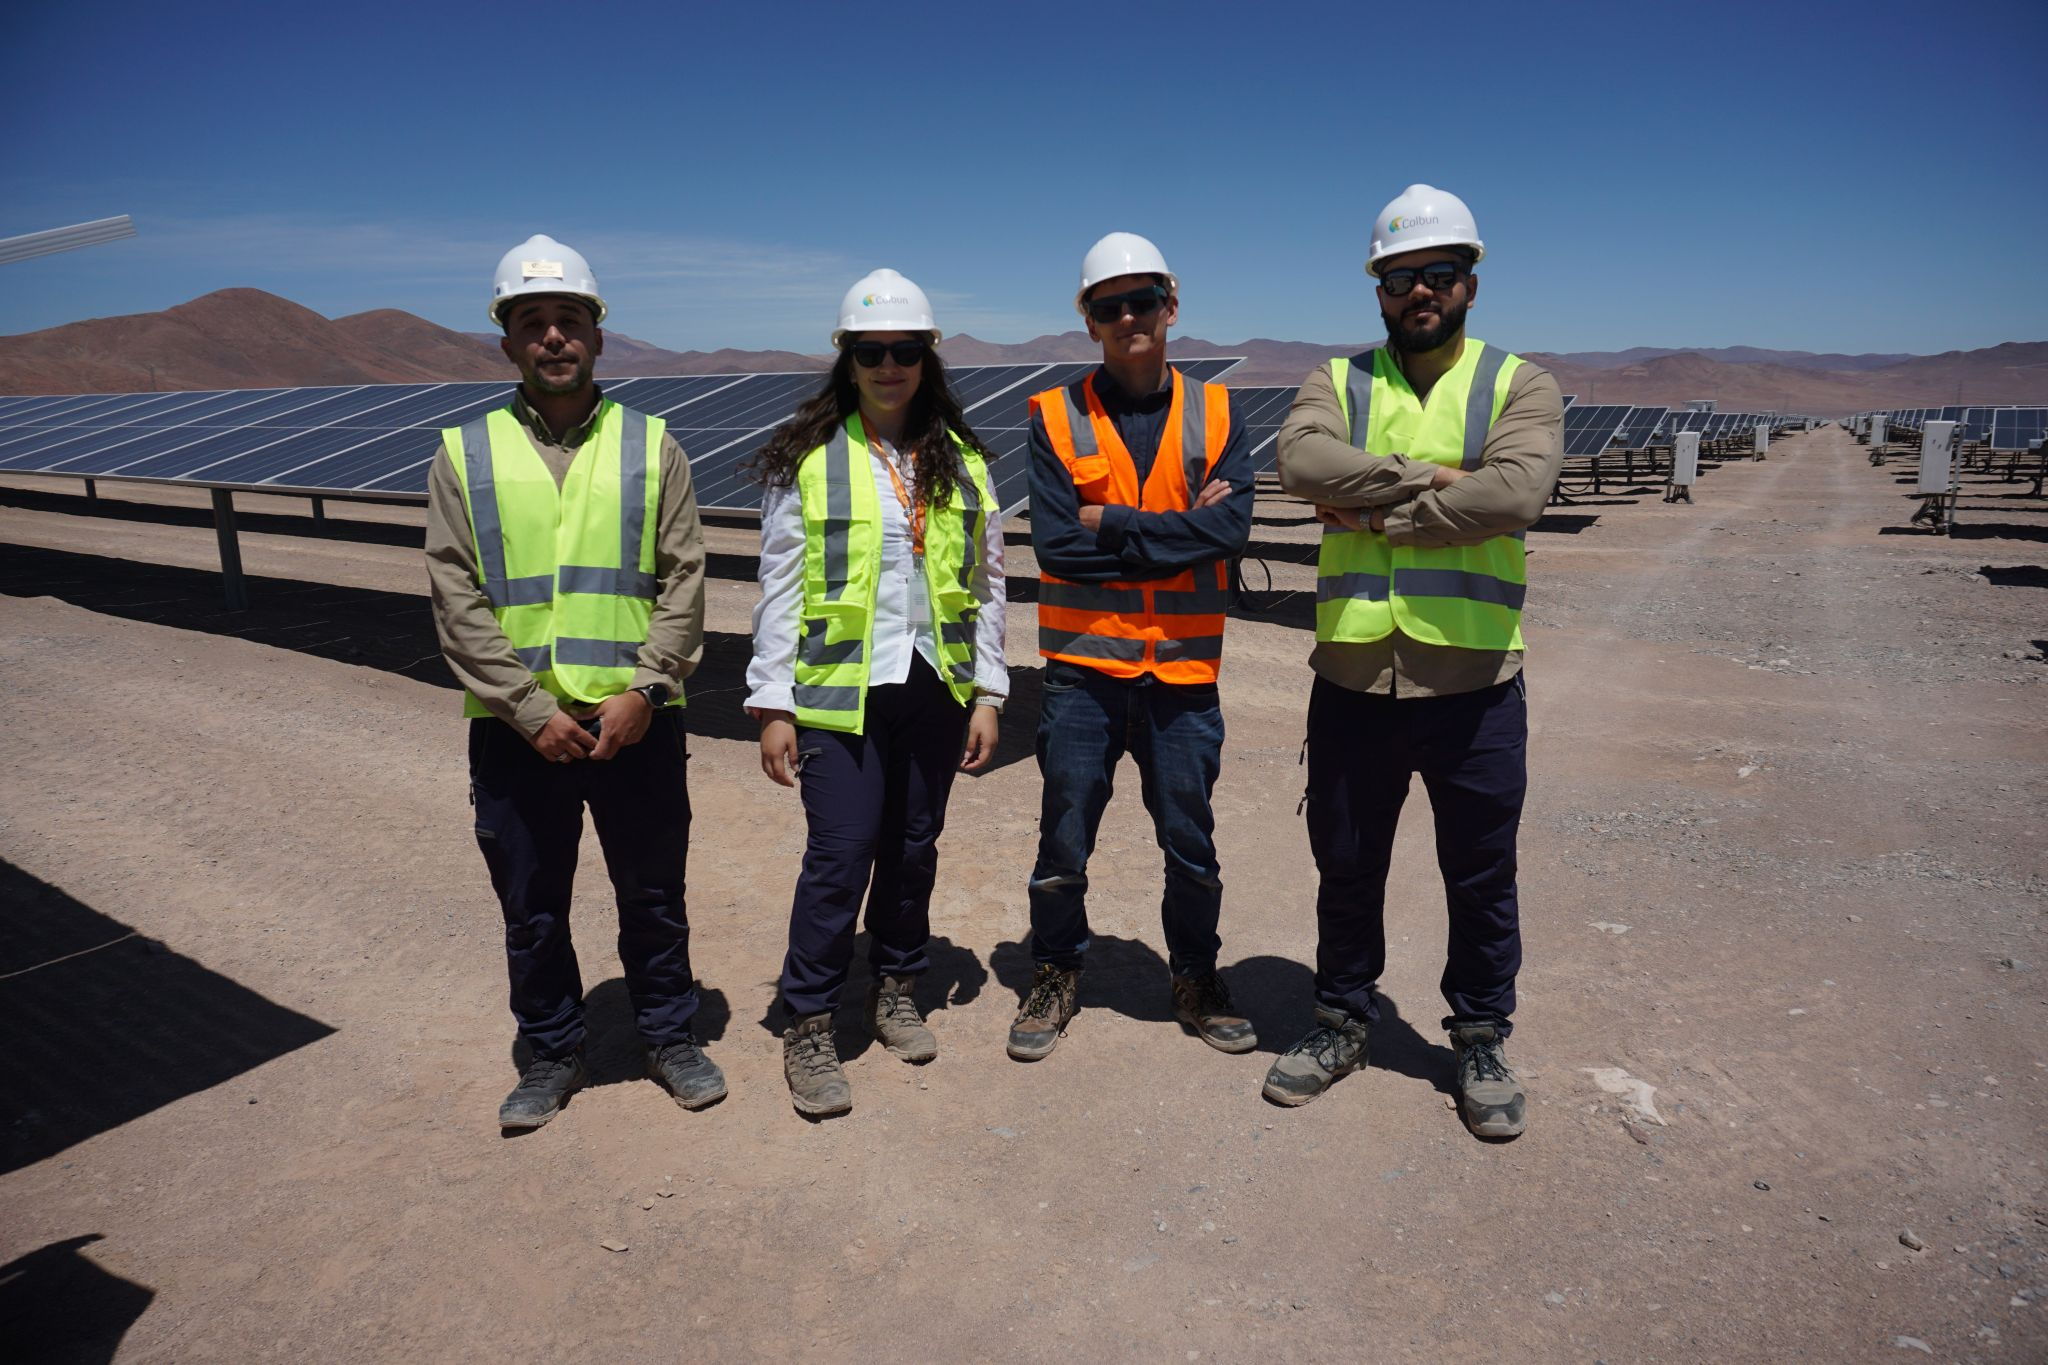
 Thore Müller, CEO of PVRADAR, visited the Diego de Almagro plant and conducted a soiling measurement workshop with the Colbún team, led by Valentina Riquelme.
Quantifying the impact of soiling, curtailment, cleaning and BESS on project profitability
Colbún, one of Chile’s leading power producers, operates the 233 MWp Diego de Almagro solar plant in the Atacama Desert. Despite excellent solar conditions, the plant’s performance is limited by high soiling, variable energy prices and grid curtailment.
To better understand these challenges, Colbún partnered with PVRADAR to perform a comprehensive analysis, aiming to identify how each factor impacts profitability and how to optimize performance.
15% cleaning cost reduction through site-specific modeling


Valentina Riquelme
Senior Performance Engineer
- To conduct this analysis, PVRADAR developed a site-specific soiling model using measurements from multiple sensors throughout the plant and local rainfall data.
- The results were fed into a digital twin that was built taking into account the impact of curtailments, variable energy prices and the BESS system on energy production and revenues.
- The cleaning optimization was carried out considering actual technical parameters and costs associated with the cleaning systems operating on site.
- PVRADAR also led an on-site workshop to help Colbún improve the accuracy and maintenance of the soiling sensors, supporting better long-term monitoring.
Understanding energy flows and the interactions of cleaning, curtailment and BESS
The plant’s actual operating conditions were defined using historical data on curtailment and energy prices. Based on this, the different energy flows were calculated, showing the gains and losses linked to each factor. The analysis also identified key interactions: soiling had a reduced impact due to curtailment, while the BESS played a significant role by recovering part of the curtailed energy, making cleaning more valuable. Moreover, effective BESS operation contributed to higher energy revenues by storing and shifting energy delivery to more profitable periods.
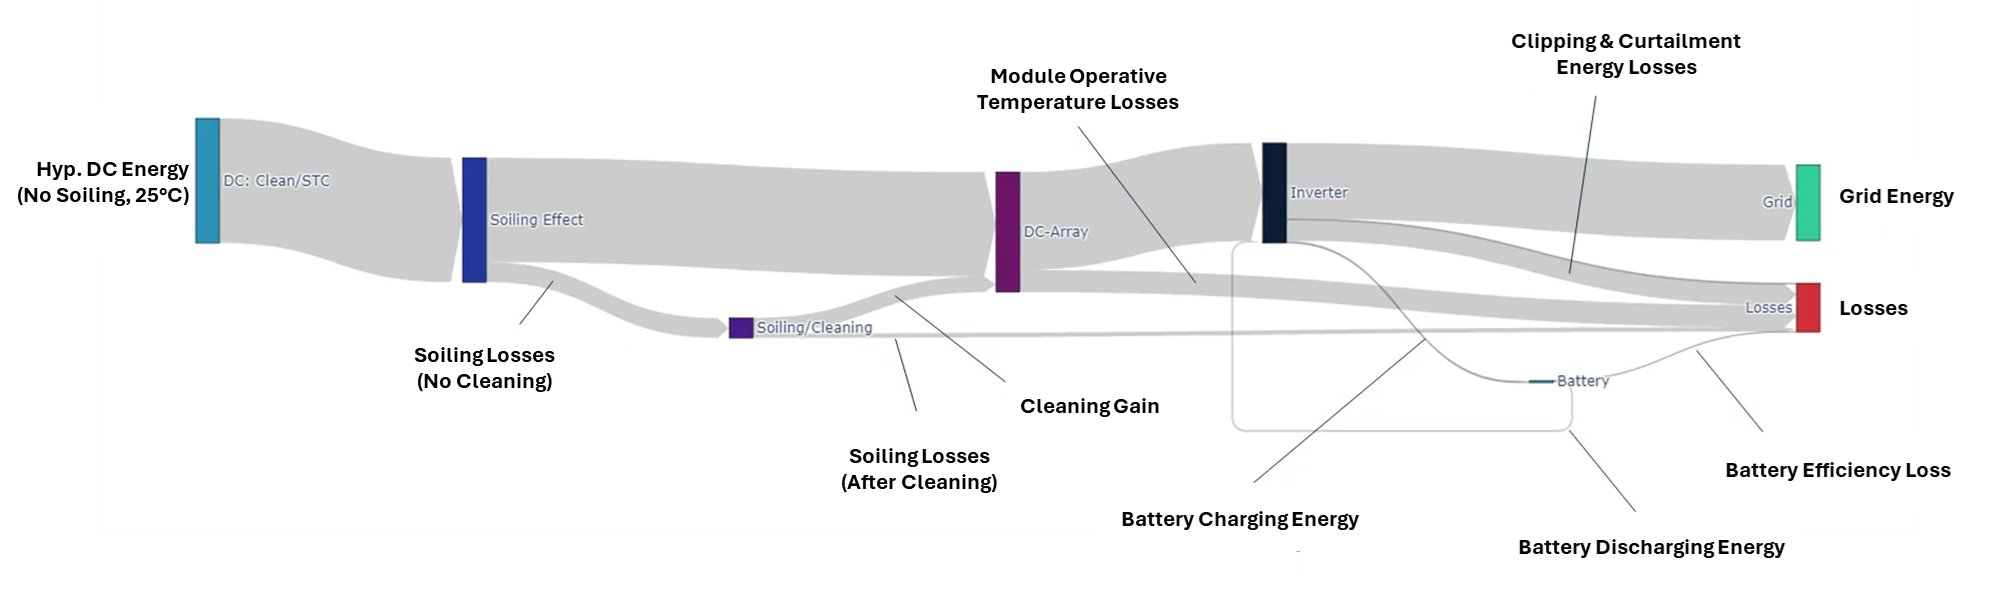 Sankey diagram showing energy flows from hypothetical DC generation to grid injection, including quantification of power losses and gains due to soiling, cleaning strategies and BESS.
Álvaro Puelma
Deputy Manager of Solar / Generation Division
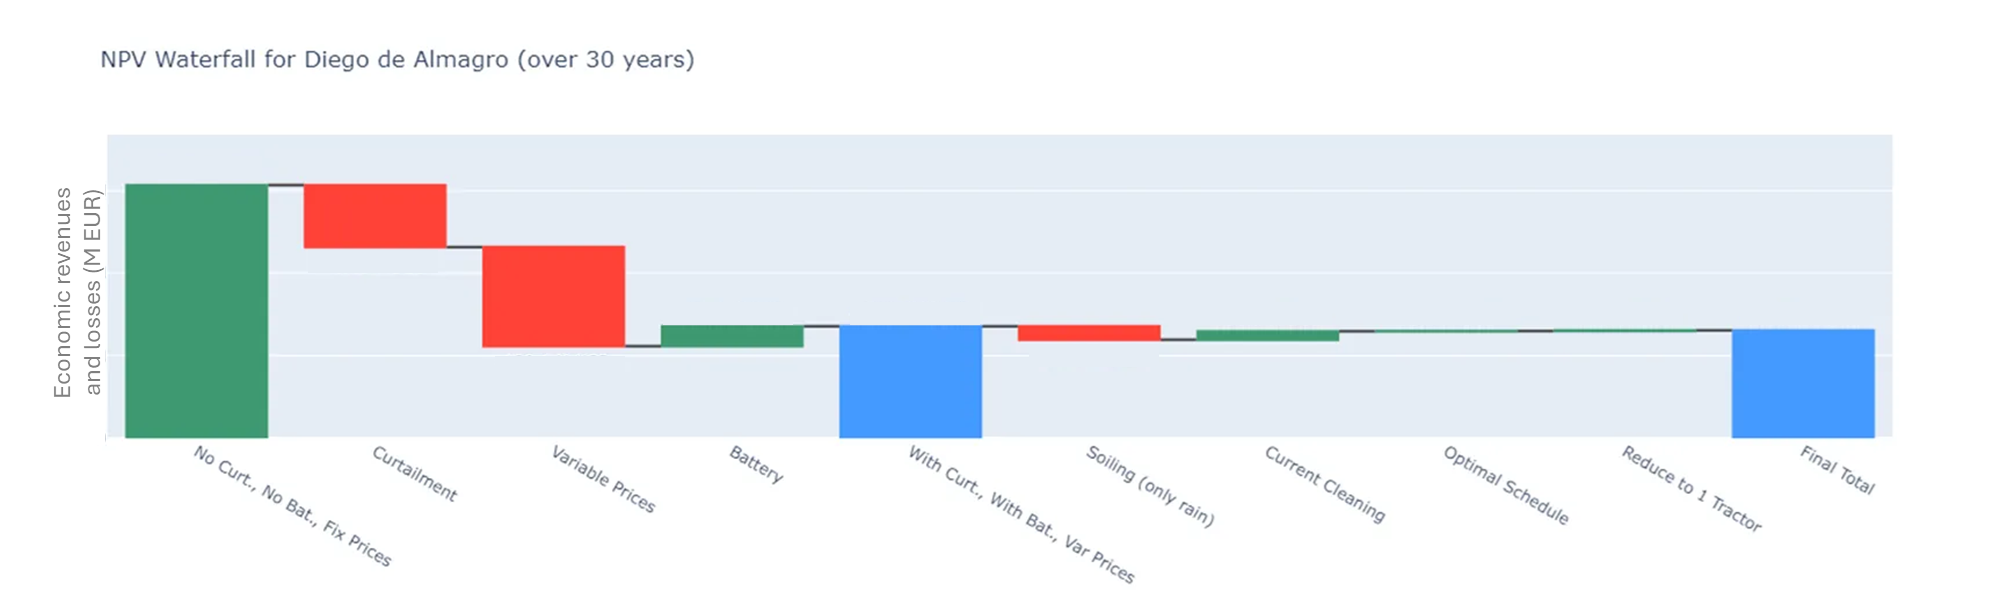 Waterfall chart illustrating the economic impact of each factor. Revenue losses are shown in red, gains in green, and the total economic value is represented in blue.

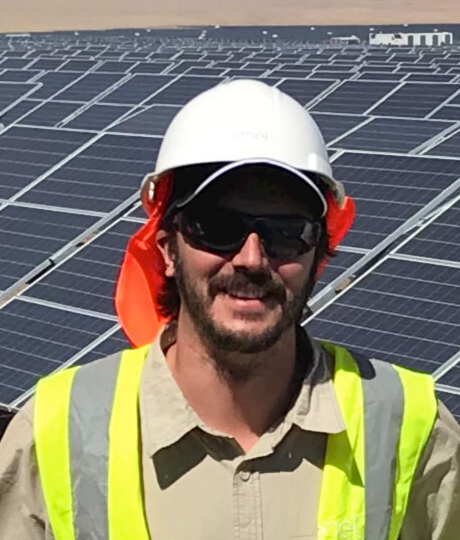
Thore Müller
CEO
Interested? Contact us.
PVRADAR delivers comprehensive assessments of soiling, curtailment, and battery impacts
helping you make data-driven decisions for complex PV project scenarios.